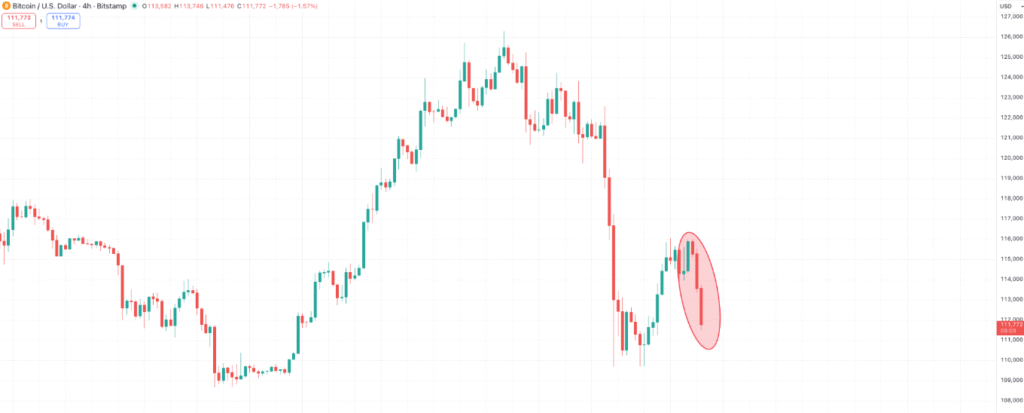
Bitcoin slips under $112K following Trump’s ban that heightens U.S.–China trade dispute
Bitcoin was trading around $111,925 at press time, down approximately 1.3% over the past 24 hours, as escalating tensions between the U.S. and China dampened investor sentiment and prompted traders to reduce their leverage.
Despite the price dip, trading activity has increased. According to CoinGlass, Bitcoin’s 24-hour spot trading volume jumped 35% to $90 billion, while derivatives trading surged nearly 40% to $144 billion.
Also Read: SOLANA PRICE OUTLOOK: TECHNICAL UPGRADES MAY DRIVE MAJOR SHIFT TOWARD $1,000
Meanwhile, open interest declined about 2% to $72.5 billion, suggesting that traders are closing leveraged positions rather than opening new ones. While this can help reduce short-term volatility, it may also leave the market susceptible to sudden price swings.
Bitcoin Struggles to Hold Gains as Geopolitical Risks Mount

On October 14, U.S. President Donald Trump escalated tensions with China by announcing plans to ban cooking oil imports from Beijing. The move came in retaliation for China’s continued boycott of U.S. soybeans, further straining already fragile trade relations. Trump’s remarks followed weeks of tariff threats and countermeasures from both sides, amplifying fears that the standoff could spiral into a full-scale U.S.–China trade war.
The latest bout of uncertainty comes on the heels of last week’s flash crash, during which more than $19 billion in crypto long positions were liquidated within just 24 hours—marking one of the largest wipeouts in market history. In the past day alone, another $600 million in leveraged bets was cleared as traders continued to unwind risk.
Attention now turns to the upcoming Federal Reserve meeting on October 29–30, where markets are pricing in an 89% probability of a 25-basis-point rate cut. However, recent Fed minutes with hawkish undertones—particularly concerns over persistent inflation—have dampened hopes for aggressive easing. Meanwhile, a stronger U.S. dollar and rising Treasury yields are exerting additional pressure on Bitcoin, which often underperforms in tight liquidity environments.
Also Read: ETHEREUM CLIMBS BACK TO $4,700 AS BULLISH MOMENTUM STAYS STRONG
Bitcoin Price Technical Analysis

Bitcoin is showing short-term weakness after falling below key moving averages, signaling ongoing bearish momentum. The 10-, 20-, and 30-day exponential moving averages (EMAs) are currently positioned above the price, reinforcing near-term downward pressure. On the downside, the 200-day EMA, hovering between $108,000 and $107,000, serves as a critical long-term support zone that traders are closely watching for potential stabilization or a rebound.
Momentum indicators remain bearish, with the Relative Strength Index (RSI) hovering around 43, signaling weakening buying strength but not yet entering oversold territory. Both the MACD and momentum oscillators are in negative zones, confirming the continued downside bias.
Trend signals also lean cautious—the Average Directional Index (ADX) stands near 25, pointing to a moderate trend that could still extend lower. Bitcoin is currently trading in the lower half of its short-term range, while Bollinger Bands show volatility cooling off but staying elevated, hinting at the potential for another sharp move.
A sustained break above the $115,000–$116,000 resistance area could reopen the path toward $123,000, whereas support around $108,000–$107,000 remains key. A loss of this zone could trigger a deeper decline toward $104,000 or even $100,000. For a bullish reversal, buyers need stronger volume confirmation on rebounds, while bears will aim for another test near the 200-day moving average.


