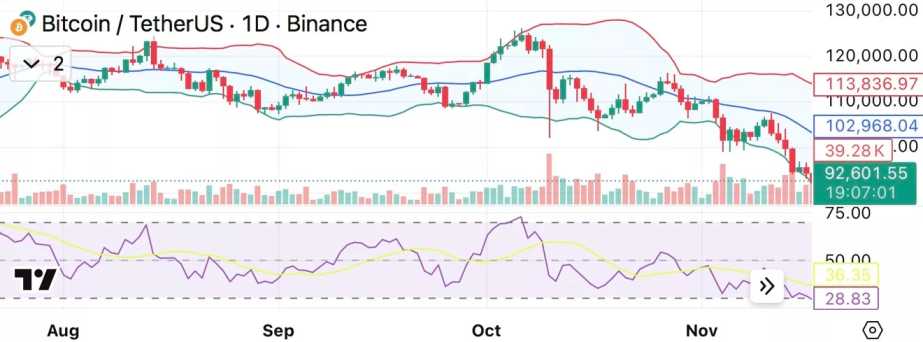
BTC BATTLES $95K RESISTANCE AS VOLATILITY HITS DOUBLE DIGITS
Bitcoin is attempting to climb back above the $95,000 level after dipping to a recent low near $89,000, a move that triggered a notable spike in implied volatility.
At press time, Bitcoin (BTC) was trading around $92,858, up about 1.8% on the day, but still down 9% over the past week and 14% over the past month. Since its all-time high of $126,080 on October 6, BTC has pulled back roughly 26%.
Spot trading activity has slowed, with trading volume dipping 2.3% to $83.8 billion, suggesting many traders are taking a wait-and-see approach. Derivatives, however, paint a different picture.
Futures volume jumped nearly 15% to $123.2 billion, and open interest rose 3.9% to $67.4 billion. Rising open interest during a pullback often indicates that traders are hedging or taking short positions, rather than expecting an immediate rebound.
On-Chain Signals Point to Weak Demand
According to a Nov. 19 Glassnode Insights report, Bitcoin is currently trading below the short-term holder cost basis and the −1 standard deviation band.
This means many recent buyers are holding at a loss, making the $95,000–$97,000 range a key resistance zone. A decisive move above this level would be the first sign that the market is starting to regain stability.
The report also highlights notable increases in implied volatility across all maturities, a reduction in speculative leverage, and substantial withdrawals from spot exchange-traded funds. Traders are paying more for downside protection—particularly around the $90,000 strike—keeping the options skew heavily tilted toward puts.
Meanwhile, the DVOL index, which tracks expected volatility in the options market, has reached a monthly high, suggesting that larger price swings could be on the horizon.
The recent selling pressure has pushed short-term holders’ realized losses to $523 million per day, the highest level since the FTX collapse. The next key support level to watch is the Active Investors’ Realized Price, around $88,600.
Finally, with $82,000 serving as the last significant structural support, a clear break below this level could trigger a more severe bearish phase.
Bitcoin Price Technical Analysis
Bitcoin is currently trading below all major moving averages, with Bollinger Bands widening as the price hugs the lower band. This suggests strong downward momentum, with the market searching for a solid support level. The Relative Strength Index (RSI) sits at 36, indicating limited momentum but not yet severe oversold conditions.

Most technical indicators remain in neutral territory, though a few are beginning to show modest bullish signals. The Commodity Channel Index (CCI) and Momentum have turned positive, hinting at the possibility of a short-term relief bounce if volatility eases. However, the MACD remains deeply negative, and the Average Directional Index (ADX) at 40 confirms that the downtrend is still firmly in place.
For sentiment to improve, Bitcoin needs a decisive close above $95,000, ideally pushing toward $97,000. Failing to reclaim these levels keeps the market at risk of another retest of $90,000, with a potential slide into the high-$80,000 range if selling pressure resumes.
FAQs
Q: What recent low did Bitcoin hit, and what happened afterward?
A: Bitcoin dipped to around $89,000, which triggered a notable spike in implied volatility as it attempted to climb back above $95,000.
Q: How has Bitcoin performed recently?
A: BTC is trading around $92,858, up 1.8% on the day, but down 9% over the past week, 14% over the past month, and roughly 26% from its October 6 all-time high of $126,080.
Q: What does the derivatives activity suggest about trader sentiment?
A: Futures volume rose nearly 15% to $123.2 billion, and open interest increased 3.9% to $67.4 billion, indicating traders are hedging or taking short positions rather than expecting an immediate rebound.
Q: What are the key resistance and support levels for Bitcoin?
A: Key resistance is at $95,000–$97,000, with crucial support levels at $88,600 (Active Investors’ Realized Price) and $82,000 (last major structural support).
Q: What do technical indicators show about Bitcoin’s current trend?
A: BTC is trading below all major moving averages, with downward momentum confirmed by Bollinger Bands and ADX at 40. RSI is 36, showing limited momentum, while CCI and momentum hint at a possible short-term relief bounce. MACD remains negative.


